Hey,
It has been two weeks since I wrote the previous journal entry, which was aimed at concluding the community bonding period and starting the coding period. The coding period has been underway since the beginning of this month, and I wanted to give an update about my progress so far, as I promised.
I’ll start by confessing one thing: the coding period has started fairly slowly for me. Unfortunately, my final exams -which I had 3 of them- spanned from June 2 to June 6, pretty much blocking my chances to do any significant coding for that week. Don’t get me wrong, though, I have done stuff. We already had a GitHub project as our project management tab, and I spent my free time looking at the task items there, organising and editing them.
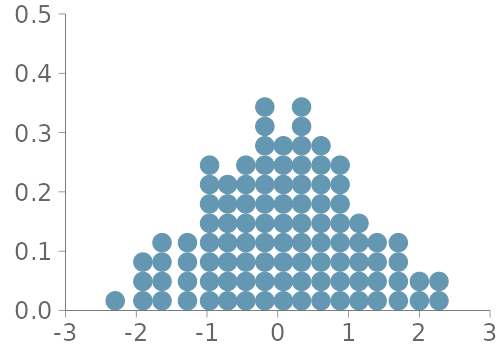
Things took off more in the second week, though. When I got freed from the school work, I had so much time to dedicate to Google Summer of Code, which I happily did. We had an initial meeting to discuss which task item I should start working on, and decided that quantile dot plots are the best option, as we anticipated that they should be rather similar in implementation compared to other graphing options we have, such as histograms or density plots. To implement this, I had two options to choose from:
- ggplot2::geom_dotplot()
- ggdist:stat_dots()
Just by looking at those functions, it was clear that ggdist::stat_dots() is simply the superior function when it comes to plotting dots on Cartesian axes, since it gives the option to plot only certain quantiles of the data. Even though it was dependent on the ggplot::geom_dotplot(), it has some very remarkable upgrades and a few extra customisation opportunities over the bare ggplot::geom_dotplot() function, which was the second option.
However, software development is never just about picking the most advanced method. If the more basic method is enough for the purposes of the project, then it’s likely to be a better fit since advanced capabilities often come with extra maintenance tasks. Therefore, I decided to examine both of the functions well enough and made my decision in an informed way.
This is not the only thing we discussed in the meeting, of course. We also discussed a lot about the testing of newly implemented functions. Testing functions that return visual objects is slightly different from testing functions that return easily comparable items. For that reason, bayesplot has a testing approach that saves the image files and compares them to see what the changes are from the previous version of the function to the next version. Bayesplot doesn’t employ a strict test-driven development; however, it was among the topics that we discussed. We also agreed about some practicalities and made sure how we want to run things moving forward, such as me being responsible for calling the meetings when I need them and Teemu being the first responsible for the project.
The first two weeks weren’t as productive as I would have wished due to school and exams; however, I am happy with the progress I have made, especially in the last week. In the next two weeks, my goal is to dedicate most of my time to implementing the dot plot function with proper testing and documentation.
See you in the next entry of GSoC diaries!